
financial model that connects operating assumptions to statements, cash flow, and KPIs
Growth decisions become harder when revenue assumptions, hiring plans, payment terms, and financing activity live in separate files. A financial model that connects operating assumptions to statements, cash flow, and KPIs gives founders one decision system: change a driver once, then see its effect on profitability, liquidity, the balance sheet, and management metrics.
Key Takeaways
- Connecting your operating assumptions to financial statements and cash flow creates one unified decision system for your business.
- When all your drivers are linked, you can quickly see how a change in revenue or hiring impacts profitability, liquidity, and key performance indicators.
- Building this integrated model provides clear visibility into your cash position and financial health, supporting smarter strategic choices.
- A well-connected financial model simplifies reporting and demonstrates a solid grasp of your business mechanics to potential investors.
The goal is a living operating tool that can be refreshed, tested against actual results, and used to decide when to hire, how much inventory to purchase, whether payment terms are workable, and how much cash the business can commit.
Build the model in sequence: operating drivers, income statement, supporting schedules, balance sheet, then cash flow statement. Each line needs a source, period, formula, and owner. A sound architecture lets changes to headcount, bookings, churn, pricing, accounts receivable, or capital spending flow through the statements and executive reporting without manual rekeying.
Why an Integrated Financial Model Is Your Operating System for Growth
A financial model that connects operating assumptions to statements, cash flow, and KPIs links company decisions to their accounting outcomes. Sales plans drive bookings and revenue recognition; hiring plans affect payroll, benefits, cash payments, and headcount; customer payment terms change accounts receivable and cash timing even when reported revenue is unchanged.
What makes a financial model truly integrated
Integration means more than placing three statements in adjacent tabs. The income statement should draw from revenue, staffing, cost of goods sold, operating expense, and depreciation schedules. The balance sheet should reflect working capital, fixed assets, debt, deferred revenue, equity, and cash movements. The cash flow statement should reconcile net income with non-cash charges and changes in operating assets and liabilities. A single assumption should have an explainable financial consequence.
Operator test: Change a meaningful driver, such as a planned hire date or customer collection period. If the model cannot show the effect on expense, cash balance, runway, and relevant KPIs without manual edits, the connection is incomplete.
The difference between static spreadsheets and a living engine
A static spreadsheet is usually built for fundraising, annual planning, or a lender request. Inputs may be hard-coded, historical actuals disconnected, and formulas exposed to copied errors. A living model separates assumptions from calculations, brings in actual results through a controlled data layer, extends forecast periods on a consistent calendar, and uses version control, formula checks, and variance commentary.
| Static planning file | Living operating model |
|---|---|
| Built around a one-time presentation | Built around monthly actuals and recurring decisions |
| Inputs mixed with formulas and outputs | Drivers, calculations, statements, and reporting are separated |
| Manual updates create reconciliation risk | Defined data imports and checks support repeatable updates |
| Shows expected results without operational ownership | Assigns owners to hiring, sales, collections, purchasing, and spending assumptions |
Why operator-led models outperform finance-only builds
Finance can design accounting logic, while sales, customer success, fulfillment, people operations, and leadership provide operating knowledge. Operators know whether pipeline coverage reflects capacity, whether a hiring date is realistic, and whether a supplier term will be accepted. Finance translates those inputs into schedules and statements and challenges unsupported assumptions. That partnership produces a financial model that connects operating assumptions to statements, cash flow, and KPIs instead of a document the business ignores.
Cypher’s Financial Strategy work covers budgeting, forecasting, variance analysis, cash-flow management, KPI design, and profitability strategy. Every important number should be traceable to an operational cause, accounting treatment, or documented assumption.
The Operator’s Architecture: Forecasting Order from Operating Drivers to Statements
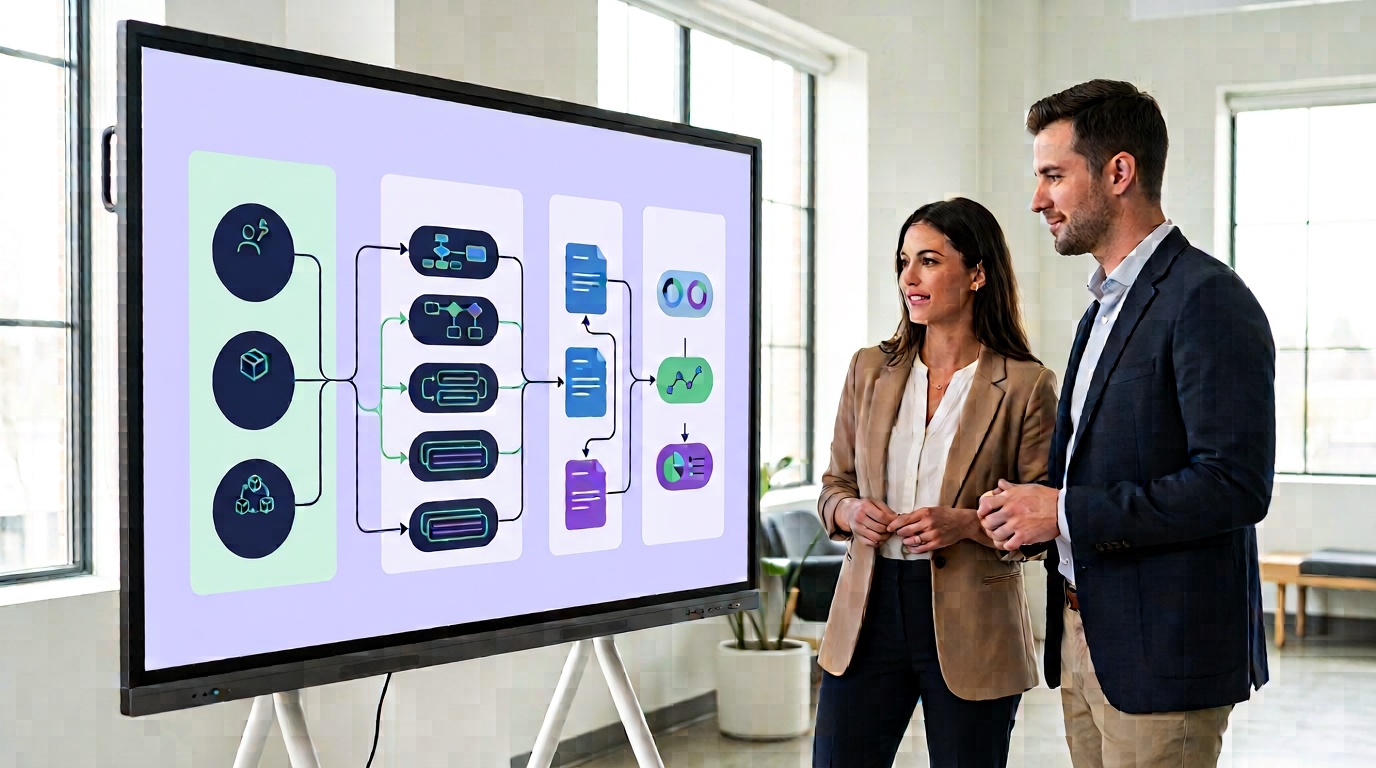
The safest build order follows causality: start with what the business does, translate activity into accounting schedules, then let statements and cash emerge. This avoids forcing a desired cash balance into the model before revenue, collections, spending, and financing mechanics are understood.
Operating drivers → driver schedules → income statement → working capital, CapEx, and debt schedules → balance sheet → cash flow statement → KPIs and decisions
Step 1: Define your operating drivers
Begin with measurable activities. Revenue may depend on units sold, average selling price, new customers, retention, utilization, or contracted recurring revenue. Headcount should include role, start date, salary, payroll burden, and hiring plan. Costs may include vendor volume, hosting, shipping, commissions, rent, software, and professional services. Record the owner, period, unit, and source.
Step 2: Build the income statement from driver schedules
Translate operational volume into revenue and expenses. Revenue formulas should follow the recognition pattern rather than cash receipts. Direct costs should follow the activity creating them; payroll should roll from headcount; depreciation should come from fixed assets. This gives a financial model that connects operating assumptions to statements, cash flow, and KPIs through visible bridges from activity to gross profit, operating income, and net income.
Step 3: Construct supporting schedules
Build accounts receivable from revenue and collection assumptions, accounts payable from purchases and payment terms, inventory from demand and replenishment, and deferred revenue from billings and recognition. Add CapEx, depreciation, debt draws, repayments, interest, lease-related balances, and equity schedules when applicable. Each schedule should reconcile beginning balance, movements, and ending balance.
Step 4: Let the balance sheet flow from those schedules
The balance sheet should be an output, not a collection of plugs. Cash comes from cash flow; receivables, inventory, payables, fixed assets, debt, and deferred revenue come from roll-forwards. Retained earnings connect prior equity with net income and distributions. Confirm that total assets equal total liabilities plus equity in every period.
Step 5: Derive cash flow and close the loop
The indirect cash flow method starts with net income, adds non-cash charges such as depreciation, and adjusts for working capital changes. An increase in accounts receivable generally represents cash not collected; an increase in accounts payable generally represents costs not paid. Investing cash flow captures long-lived assets, while financing cash flow captures debt, equity, and distributions. Ending cash feeds the balance sheet and starts the next period.
| Model component | Typical driver or bridge | Primary output |
|---|---|---|
| Revenue schedule | Units, price, customers, retention, or utilization | Revenue and accounts receivable |
| Headcount schedule | Role, start date, compensation, payroll burden | Payroll expense and cash payments |
| Working capital schedule | Collection, payment, inventory, and billing assumptions | Operating cash movement and balance sheet balances |
| Debt schedule | Draws, repayments, rates, and maturity dates | Interest expense, debt balance, and financing cash flow |
Separate inputs, calculations, and outputs; use consistent periods; avoid hard-coded values inside long formulas; and label historical actuals separately from forecasts. This makes a financial model that connects operating assumptions to statements, cash flow, and KPIs easier to refresh and explain.
Industry Driver Blueprints: Translating Unit Economics into Financial Lines
Assumptions should reflect how the business operates. Subscription companies need retention and expansion; e-commerce companies need inventory timing and fulfillment economics; services firms need capacity, utilization, and backlog. The right structure translates activity into margin, working capital, cash requirements, and trade-offs.
| Business type | Operating drivers | Financial statement connections |
|---|---|---|
| SaaS and subscriptions | New customers, churn, retention, pricing, expansion, contract terms | Recurring revenue, deferred revenue, customer acquisition cost, receivables, cash collections |
| E-commerce and inventory | Units, average order value, returns, lead times, inventory turns, shipping cost | Revenue, cost of goods sold, inventory, payables, fulfillment expense, purchasing cash flow |
| Services and projects | Headcount, billable hours, utilization, rates, backlog, delivery timing | Revenue recognition, payroll, accounts receivable, unbilled revenue, cash collections |
SaaS and subscription businesses: cohort retention, churn, ARR
Model beginning customers, new bookings, logo churn, revenue churn, expansion, contraction, pricing changes, and contract start dates. Monthly recurring revenue can roll into annual recurring revenue, recognized revenue, billings, and accounts receivable. An annual contract may create deferred revenue and cash before the income statement recognizes its full value.
Link customer acquisition spending to channel, conversion, sales capacity, and hiring timing. Churn should reflect renewal periods and cohort behavior rather than repeat a blended historical rate when customer mix changes.
E-commerce and inventory businesses: lead times, turns, fulfillment costs
Start with units sold, average order value, returns, discounts, and channel mix. Convert demand into purchasing requirements using lead times, safety stock, minimum order quantities, and inventory turns. Purchasing drives cost of goods sold, inventory, accounts payable, freight, warehousing, and fulfillment expense. Stronger sales can still create a cash squeeze when stock must be purchased before customers pay.
Test payment terms as operating decisions. Supplier extensions can delay cash outflow without changing gross profit; faster customer settlement can improve liquidity without increasing reported revenue. Include landed cost, payment processing, returns, shrinkage, and shipping subsidies when they affect contribution margin.
Services and project-based businesses: utilization, billable hours, backlog
Forecast available hours from headcount, working days, holidays, and staffing changes. Apply utilization to determine billable hours, then rates by role, client, or project type. Backlog should roll from opening contracted work, new bookings, recognized revenue, cancellations, and delivery timing. Connect project schedules to unbilled revenue, receivables, deferred revenue, payroll, subcontractor costs, and collections.
Cypher’s Financial Strategy work supports budgeting, forecasting, variance analysis, cash-flow management, KPI design, and profitability strategy around these drivers.
Defensive Financial Modeling: Automated Checks That Keep Your Model Sound
Confidence comes from visible mechanics, not a clean dashboard. Build checks beside affected schedules so errors appear before they distort cash, runway, margin, or management reporting. This matters especially with deferred revenue, credit facilities, lease balances, multiple payment terms, or significant inventory.
Dynamic balance sheet balancing: the cash plug and revolver mechanics
Cash should normally be the cash flow output. If projected cash falls below an approved minimum, a revolver schedule can calculate a draw subject to borrowing capacity; excess cash can support permitted repayment. Keep the minimum cash policy, facility limit, interest rate, and repayment priority as explicit inputs. Do not hide a balancing plug inside another asset or liability.
Useful checks include Total assets - Total liabilities - Total equity = 0, beginning cash plus net movement equaling ending cash, debt opening balance plus draws less repayments equaling ending debt, and retained earnings rolling from prior equity plus net income less distributions.
Setting validation gates to catch errors before they hit KPIs
Flag negative inventory, unreconciled receivables, missing headcount dates, revenue without a customer or unit driver, hard-coded forecast values, duplicated cohorts, broken period links, negative debt, and cash below the approved minimum.
- Balance sheet check equals zero in historical and forecast periods.
- Cash flow ending cash agrees with the balance sheet cash balance.
- Working capital schedules reconcile opening balances, movements, and closing balances.
- Revenue, cost, headcount, and capital spending inputs have documented owners.
- Actual periods are protected from accidental forecast overwrites.
- Scenario selections change approved inputs without changing core formulas.
Working capital reconciliation: from driver days to cash movements
Forecast receivables from revenue and collection days, inventory from cost of goods sold and inventory days, and payables from purchases and payment days. The cash flow statement captures the movement: increases in receivables and inventory use cash, while increases in payables provide cash. Show both balances and changes.
The indirect cash flow method usually fits a three-statement model because it begins with net income and adjusts for non-cash effects and operating asset and liability movements. The direct method shows cash received from customers and cash paid to suppliers, employees, and others. Keep the chosen presentation consistent and reconcile it to beginning and ending cash.
| Check or formula | What it tests |
|---|---|
| Ending cash = beginning cash + net cash change | Cash flow completeness |
| Receivables movement = ending balance minus beginning balance | Collection timing and operating cash use |
| Debt ending balance = opening debt + draws minus repayments | Financing schedule integrity |
| Assets minus liabilities minus equity = zero | Balance sheet integrity |
Cypher’s Financial Strategy offering connects budgeting, forecasting, variance analysis, cash-flow management, KPI design, and profitability strategy to reliable financial operations. The standard is a model that surfaces exceptions early and shows the operating decision behind each movement.
From Model to Decisions: Connecting Drivers to Executive KPIs and Rolling Forecasts

A financial model that connects operating assumptions to statements, cash flow, and KPIs is useful when leadership can apply it during operating decisions. Update actuals, review driver changes, run checks, inspect KPI movement, and assign the next decision owner.
Live KPI dashboard: runway, burn rate, gross margin, LTV:CAC, Magic Number
Build the dashboard from model outputs. Runway should use available cash and a defined burn measure. Gross margin should reconcile revenue with direct costs. LTV:CAC needs consistent customer, contribution margin, retention, and acquisition-cost definitions. Magic Number needs a documented revenue-growth and sales-and-marketing investment convention. Display the measures that explain liquidity, efficiency, demand, and capacity.
Designing a rolling forecast that updates in five minutes
Lock historical periods, import approved actuals, maintain one assumptions register, and separate inputs from formulas. Assign owners to revenue, hiring, collections, purchasing, and financing. Refresh by loading actuals, extending the forecast horizon, updating drivers, reviewing exception flags, and publishing the dashboard. Cypher’s Financial Strategy offering supports this operating cadence.
Scenario and sensitivity analysis: base, best, worst cases with one toggle
Use one selector to change approved assumptions while keeping accounting structure constant. The base case reflects the current plan; best and worst cases change drivers such as conversion, churn, hiring pace, pricing, collections, or inventory timing. Review cash, runway, gross margin, headcount, and financing needs. Scenarios are decision boundaries, not predictions.
| Scenario | Decision question | Outputs to review |
|---|---|---|
| Base | Does the approved plan remain funded? | Cash balance, runway, margin, hiring capacity |
| Best | Where can capacity or investment increase? | Growth rate, working capital, staffing needs |
| Worst | Which action protects liquidity first? | Burn, collections, spending, financing headroom |
With Financial Strategy, the practical verdict is to maintain a small driver set, a documented refresh routine, and scenario outputs tied to named decisions. That keeps the model useful after the planning meeting.
Frequently Asked Questions
What are the three types of financial models?
The three commonly used financial models are three-statement models, discounted cash flow models, and merger or acquisition models. A financial model that connects operating assumptions to statements, cash flow, and KPIs often serves as the base for these analyses, linking revenue, staffing, working capital, financing, and cash decisions.
What is a 3-statement model in financial modeling?
A 3-statement model connects the income statement, balance sheet, and cash flow statement through shared assumptions and supporting schedules. A financial model that connects operating assumptions to statements, cash flow, and KPIs shows how changes in sales, hiring, collections, inventory, or capital spending affect profit, liquidity, and management metrics.
What is the BIWS 3-statement model?
The BIWS 3-statement model is a structured forecasting framework taught by Breaking Into Wall Street that links the income statement, balance sheet, and cash flow statement. The framework typically uses schedules for working capital, fixed assets, debt, and equity so operating changes flow through the full financial model.
What are assumptions in a financial model?
Assumptions in a financial model are documented expectations about operating activity, timing, pricing, costs, collections, hiring, financing, and other business drivers. Each assumption should have a source, period, unit, and owner, allowing a financial model that connects operating assumptions to statements, cash flow, and KPIs to show a traceable business effect.
What are the four main components of financial modeling?
The four main components of an integrated financial model are operating assumptions, supporting schedules, financial statements, and KPIs or decision outputs. Operating assumptions drive schedules for revenue, staffing, working capital, and capital spending, while the statements and KPIs translate those mechanics into profitability, cash, liquidity, and planning guidance.
Why should a financial model connect operating assumptions to cash flow and KPIs?
A financial model should connect operating assumptions to cash flow and KPIs so leaders can see the financial effect of decisions before committing resources. A planned hire, pricing change, longer collection period, or inventory purchase can then be evaluated through expense, cash balance, runway, balance sheet accounts, and operating metrics.